
Selecting a pump based solely on the highest flow rate listed in a catalog is the fastest way to guarantee premature mechanical seal failure and inflated energy bills. Having a pump performance curve explained is about more than reading a chart; it's about ensuring your hardware doesn't fight against your piping. Many industrial operators struggle with the distinction between total dynamic head and pressure (PSI). This confusion often leads to oversized equipment that operates far from its intended design point, causing frequent vibration and hardware fatigue.
This guide provides the technical expertise needed to master these charts according to the latest ANSI/HI 14.3-2024 standards. You'll learn to accurately identify the Best Efficiency Point (BEP), prevent cavitation, and understand how impeller diameter changes impact performance. We'll examine how to select industrial hardware from manufacturers like Goulds Water Technology to ensure your system remains compliant with the upcoming IE4 motor efficiency standards taking effect June 1, 2027. By mastering these data points, you can optimize flow and reduce the total life-cycle cost of your industrial water systems.
Key Takeaways
- Define the relationship between Flow Rate (GPM) and Total Dynamic Head (TDH) to eliminate common equipment oversizing errors.
- Use a structured five-step process to have your pump performance curve explained and identify where your hardware meets specific system resistance.
- Analyze the critical balance between NPSHr and NPSHa to prevent the mechanical fatigue and noise caused by pump cavitation.
- Locate the Best Efficiency Point (BEP) to optimize the long-term energy performance of industrial hardware like Goulds Water Technology Pumps.
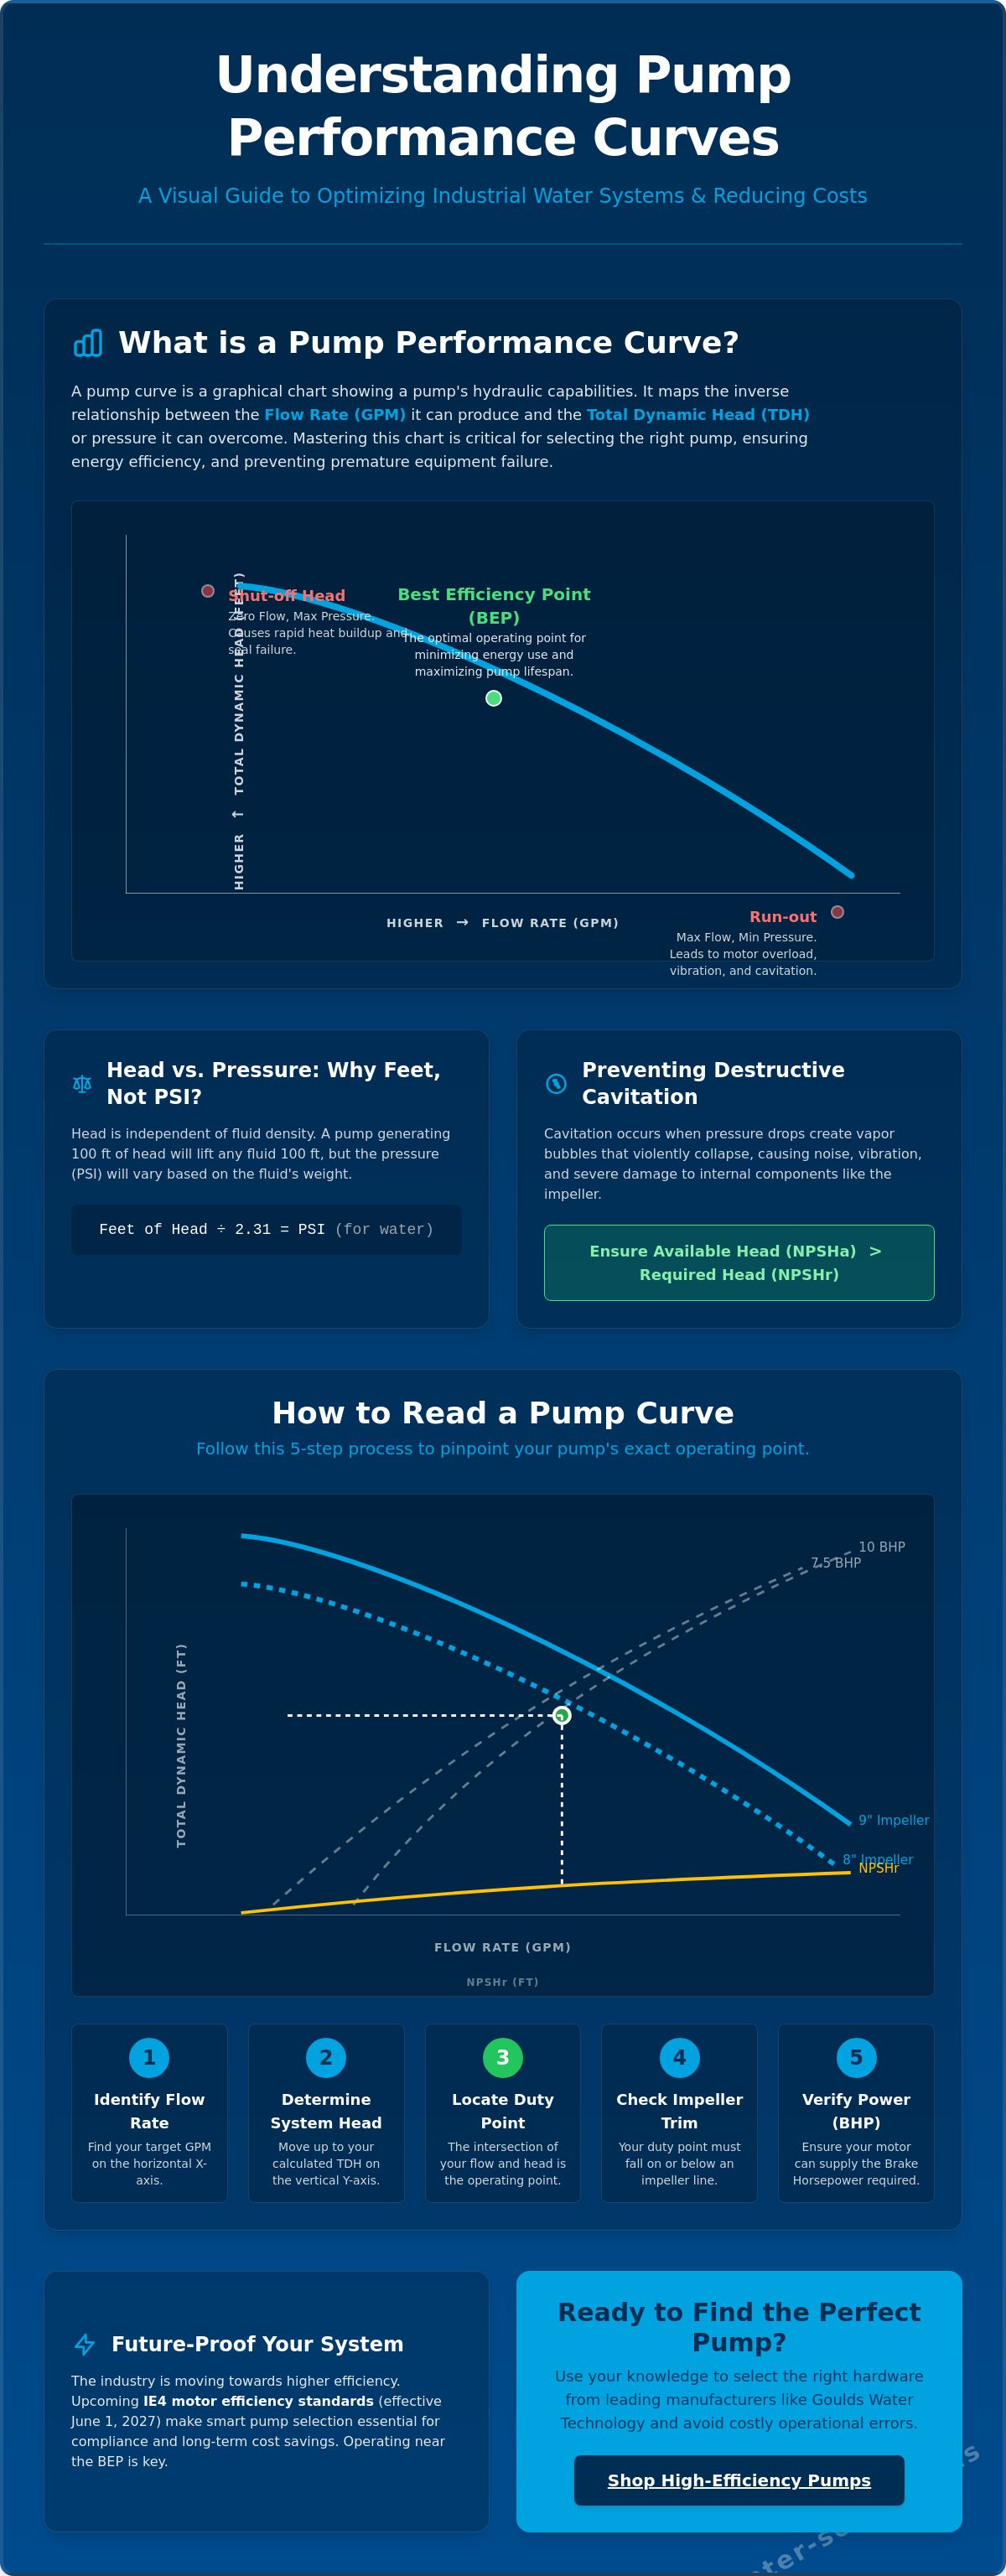
What is a Pump Performance Curve?
A pump performance curve is a graphical representation of a pump's hydraulic capability. It maps the relationship between flow rate and pressure, ensuring that equipment like Goulds Water Technology Pumps are matched correctly to specific system requirements. For those seeking a foundational understanding of What is a Pump?, these curves serve as the primary tool for evaluating mechanical efficiency and operational range. Every curve is unique to a specific pump model, speed, and impeller diameter.
The horizontal X-axis represents the flow rate, typically measured in Gallons Per Minute (GPM). This indicates the volume of fluid the pump moves over time. The vertical Y-axis represents Total Dynamic Head (TDH), measured in feet. Unlike static pressure, this metric accounts for the total resistance the pump must overcome to move fluid through the system. Having a pump performance curve explained in a technical context allows engineers to predict how a pump will react when system conditions change.
Centrifugal pumps exhibit a curved line that slopes downward from left to right. As flow increases, the pump's ability to generate head decreases. Positive displacement pumps, such as Pulsafeeder metering units, differ significantly. Their curves are nearly vertical because they deliver a constant volume per stroke regardless of the discharge pressure. This distinction is vital for hardware selection; centrifugal pumps require precise sizing to meet a duty point, while positive displacement pumps require over-pressure protection because they don't "back down" the curve.
Head vs. Pressure: Why Pumps Use Feet, Not PSI
Industrial specifications prioritize feet of head over PSI because head is a constant measurement regardless of fluid density. A pump that generates 100 feet of head will push water 100 feet vertically and will do the same for a heavier brine solution. However, the pressure (PSI) would change based on the fluid's specific gravity. The conversion is straightforward: Feet of Head divided by 2.31 equals PSI. Total Dynamic Head (TDH) is the sum of static head and friction loss within the piping system.
The Inverse Relationship of Flow and Head
Centrifugal pump performance is defined by a trade-off between volume and resistance. When the system resistance increases, the flow rate decreases. This relationship is critical for avoiding operational extremes that damage internal components. Using a pump performance curve explained by the manufacturer helps identify two critical limits:
- Shut-off Head: This is the point on the far left of the curve where flow is zero. The pump is operating against a closed valve, reaching its maximum pressure. Prolonged operation here causes rapid heat buildup.
- Run-out: This is the point on the far right where the pump produces maximum flow at minimum pressure. Operating near run-out often leads to motor overload and vibration.
Staying within the preferred operating range prevents these extremes and extends the life of seals and bearings.
How to Read a Pump Curve in 5 Steps
Translating technical data into equipment selection requires a systematic approach to the manufacturer's chart. Having a pump performance curve explained through these five steps ensures that your selected hardware meets the hydraulic demands of your facility without overstressing the motor or seals. Follow this sequence to plot your requirements accurately.
- Identify Required Flow Rate: Locate your target Gallons Per Minute (GPM) on the horizontal axis. This value represents the volume necessary for your specific industrial process.
- Determine System Head: Move vertically to find your calculated Total Dynamic Head (TDH) on the Y-axis. This must include both the vertical lift and the friction losses from your piping and valves.
- Locate the Duty Point: Find the intersection where your GPM and TDH meet. This point represents the specific hydraulic condition where the pump will operate in your system.
- Check Impeller Trim Lines: Identify which curved line passes through or just above your duty point. These lines correspond to specific impeller diameters available for that pump housing.
- Verify Brake Horsepower (BHP): Look for the BHP lines crossing the curve at your duty point. This indicates the actual power required from the motor to maintain that performance level.
Once you've identified your duty point, you can evaluate the technical specifications of Goulds Water Technology Pumps to ensure they align with your power and flow requirements. Selecting the correct intersection is the only way to avoid the high energy costs associated with oversized equipment.
Finding the Best Efficiency Point (BEP)
The Best Efficiency Point (BEP) is the specific location on the curve where the pump operates at its peak hydraulic efficiency. At this point, the radial forces on the impeller are balanced, resulting in the lowest possible vibration and heat. To maximize industrial longevity, engineers should aim to operate within 80% to 110% of the BEP. Operating too far to the left (low flow) or too far to the right (high flow) leads to premature bearing wear and mechanical seal failure because of increased shaft deflection.
Understanding Impeller Trim Lines
Industrial pump manufacturers often use a single casing design to accommodate various impeller sizes. On a standard performance chart, you'll see multiple curved lines stacked vertically; these represent different impeller diameters. Varying the impeller diameter, or "trimming" it, shifts the entire performance curve. A larger impeller provides higher head and flow, while a smaller one reduces output and power consumption. Goulds Water Technology curves typically display these diameters clearly, allowing for precise hydraulic tuning to match your system resistance without changing the entire pump housing.
The Missing Link: Pump Curves vs. System Curves
A manufacturer's chart shows the potential of the hardware, but it cannot predict actual performance without accounting for the environment. To have a pump performance curve explained accurately, it must be overlaid with a system curve. This second curve represents the unique resistance of your facility's infrastructure, including all piping, valves, and elbows. The pump will only operate where these two lines intersect. This intersection is the "operating point," and it dictates the actual flow and head your system will experience during active service.
System resistance is not a static value. Modifying the pipe diameter or adjusting valve positions shifts the system curve, which in turn forces the operating point to move along the pump curve. A common error in industrial selection is "over-sizing" the pump. If the pump is too powerful for the system's resistance, the operating point slides to the far right of the chart. This condition, known as run-out, leads to excessive vibration, seal damage, and potential motor failure due to the high horsepower demand at maximum flow rates.
Static Head vs. Friction Head
The system curve is composed of two distinct components. Static head is the vertical distance the fluid must be lifted; this value is constant and does not change with flow rate. Friction head is the resistance generated by the fluid as it moves through the piping. Unlike static head, friction loss increases exponentially as the flow velocity increases. The system curve starts at the static head value on the vertical axis and slopes upward as flow increases, representing the total pressure the pump must overcome at any given volume.
Adjusting Performance with Variable Frequency Drives (VFDs)
Standard pump curves assume a fixed motor speed, typically 3600 or 1800 RPM. In many industrial water treatment applications, demand varies, making a fixed-speed pump inefficient. Variable Frequency Drives (VFDs) allow operators to "tune" the pump curve by adjusting the motor's hertz. This allows the pump to meet the system curve at a lower speed rather than using a throttle valve to artificially increase friction. Implementing Electric Power Controls reduces mechanical stress and provides significant energy savings by ensuring the motor only consumes the power necessary for the current duty point.
Advanced Metrics: NPSH, Efficiency, and Power
Advanced metrics provide the final layer of technical verification required for a reliable installation. Net Positive Suction Head (NPSH) is the most critical of these variables. It represents the absolute pressure at the suction port of the pump. To have a pump performance curve explained accurately for maintenance teams, you must distinguish between NPSH Required (NPSHr) and NPSH Available (NPSHa). NPSHr is a fixed value determined by the pump manufacturer through testing. NPSHa is a dynamic value calculated based on your specific suction piping and tank elevation.
Cavitation occurs when the NPSHa drops below the NPSHr. This causes the fluid to vaporize into small bubbles that implode against the impeller. Maintenance technicians identify this by a distinct sound, often described as pumping gravel or marbles. This physical implosion pits the metal surfaces of the impeller and leads to rapid mechanical seal failure. Ensuring a sufficient margin between available and required head is the only way to prevent this destructive phenomenon.
Efficiency curves appear as kidney-shaped iso-efficiency lines on the chart. These lines indicate the percentage of energy successfully converted into fluid movement. Staying within the highest efficiency "island" minimizes heat buildup and reduces long-term operating costs. Similarly, Brake Horsepower (BHP) lines indicate the actual load on the motor. If your operating point shifts toward the right of the curve, the BHP demand increases. You must verify that your motor has the nameplate capacity to handle the maximum power demand at the end of the curve to prevent thermal trips.
The Impact of Specific Gravity and Viscosity
Mining slurries and heavy industrial oils change the power requirements significantly. Specific gravity (SG) does not change the feet of head a pump produces. A pump rated for 100 feet of head will push a heavy slurry 100 feet high. However, because the fluid is denser, the pressure in PSI will be higher and the motor will require more horsepower to move the weight. Utilizing Water Treatment Chemicals to manage fluid properties can help maintain predictable viscosity and prevent unexpected motor overloads.
Environmental and Safety Considerations
Operating off-curve creates excessive radial thrust, leading to shaft deflection and mechanical seal leaks. These failures often occur under high pressure or elevated temperatures. When inspecting vibrating or leaking equipment, technicians must utilize proper Personal Protective Equipment (PPE) to guard against hazardous sprays or hot surfaces. For precise measurement of these operational variables, you can find industrial-grade sensors and gauges at Water Services, Inc.
Selecting the Right Pump for Your Operation
Selecting industrial hardware requires moving beyond theoretical data to practical application. Having a pump performance curve explained allows for the final verification of hardware against system resistance. For high-stakes industrial environments, the accuracy of manufacturer data is paramount. Goulds Water Technology Pumps remain the industry standard because their performance curves are derived from rigorous hydraulic testing that meets or exceeds HI 14.6-2022 standards. This level of precision ensures that the duty point plotted during the design phase matches the actual output once the equipment is energized at the site. Relying on verified data prevents the common pitfall of selecting a pump that looks acceptable on paper but fails to perform under real-world friction losses.
Goulds Water Technology: Precision Engineering
The reliability of Goulds data facilitates long-term industrial planning and reduces the risk of operational surprises. Professionals can browse specific models and technical specifications in our Pumps Collection to find hardware that aligns with calculated duty points. These curves provide transparent metrics for NPSHr and brake horsepower, which are essential for maintaining system integrity. Water Services, Inc. provides comprehensive technical support for curve interpretation to ensure your selection accounts for all system variables. We help you translate these complex charts into a reliable hardware list that meets your facility's specific hydraulic requirements.
Custom Modular Solutions
Complex operations in remote locations often benefit from pre-engineered configurations. Water Services, Inc. designs containerized Reverse Osmosis plants where the pumps and curves are already optimized for specific flow and pressure requirements. These systems offer a plug-and-play advantage for remote mining or oil sites where onsite engineering resources are limited. Integrated systems ensure that the pump is perfectly matched to the membrane's feed requirements, eliminating the risk of operating off-curve. For more context on these specialized applications, review our guide on Mining Wastewater Treatment Solutions. These modular plants utilize high-efficiency motors to remain compliant with the upcoming IE4 standards taking effect June 1, 2027.
Consulting with engineering experts is essential for specialized military or mining water needs where fluid properties vary. A single error in having a pump performance curve explained for a high-head application can lead to catastrophic motor failure or system downtime. Water Services, Inc. offers custom curve analysis to verify that your selected hardware will operate within the Best Efficiency Point (BEP). This technical oversight ensures your system remains stable across its entire lifecycle. Contact our technical team to request a professional review of your system curves before finalizing your equipment procurement.
The logic of matching hardware capacity to system demand is universal across fluid and thermal management. For instance, Commodus demonstrates this by helping property owners select the optimal power for heating solutions, ensuring long-term efficiency and reliability in residential settings.
Optimize Your Industrial Fluid Systems
Proper hardware selection is a technical requirement for operational stability. You've identified how the intersection of pump and system curves dictates performance and why staying near the Best Efficiency Point (BEP) prevents mechanical failure. Understanding the balance between NPSHr and NPSHa remains the primary defense against cavitation and premature seal wear. These metrics ensure your system operates at peak efficiency while minimizing energy consumption.
With a pump performance curve explained through technical specifications, you can confidently select hardware that meets the rigors of industrial service. Water Services, Inc. has provided specialized engineering expertise since 1994, serving as an authorized Goulds Water Technology distributor with global logistics capabilities for the mining and military sectors. We ensure your equipment selection is grounded in hydraulic integrity rather than guesswork. Accurate data is the foundation of a reliable water system.
Browse our Goulds Water Technology Pumps and technical specs to secure the right hardware for your next project. Our team is ready to help you optimize your fluid handling operations.
Frequently Asked Questions
What is the difference between NPSHr and NPSHa?
NPSHr is the minimum pressure required at the suction port to prevent cavitation, a value determined by the manufacturer through standardized testing. NPSHa is the actual pressure available in your system based on tank elevation, atmospheric pressure, and friction losses. To maintain hydraulic stability and prevent hardware damage, the available pressure must always exceed the required pressure by a safe margin.
Can I use a pump if my duty point is to the right of the BEP?
Operating to the right of the Best Efficiency Point (BEP) is possible but increases the risk of motor overload and cavitation. As flow increases beyond the BEP, the NPSH required by the pump rises while the available system head decreases. This often leads to run-out conditions where the hardware experiences high vibration and significantly reduced mechanical seal life.
How does changing the impeller diameter affect the pump curve?
Reducing the impeller diameter, or trimming, shifts the entire performance curve down and to the left. This modification reduces both the total dynamic head and the flow rate without changing the pump housing or motor speed. It's a standard method for matching a pump to a specific duty point when a variable frequency drive is not installed in the system.
Why does my pump vibrate when it is running at low flow?
Vibration at low flow is typically caused by internal recirculation and radial thrust imbalance. When a pump operates too far to the left of its curve, the fluid remains in the casing longer, leading to heat buildup and turbulent flow patterns. This instability puts excessive stress on the bearings and can lead to shaft deflection or premature seal failure.
Does fluid temperature affect the pump performance curve?
Fluid temperature affects the vapor pressure of the liquid, which directly impacts the NPSHa calculation. As temperature increases, vapor pressure rises, reducing the net pressure available to the pump suction. Having a pump performance curve explained alongside vapor pressure charts is essential for high-temperature industrial water treatment to prevent fluid flashing and destructive cavitation.
What is Shut-off Head and is it dangerous for the pump?
Shut-off head is the maximum pressure a pump generates at zero flow, typically when the discharge valve is closed. Operating at this point is dangerous because the energy from the motor is converted entirely into heat rather than fluid movement. This can cause the water in the casing to boil, damaging the mechanical seals and potentially causing the pump housing to rupture.
How do I convert PSI to Feet of Head for a pump curve?
To convert PSI to Feet of Head, multiply the PSI by 2.31 and divide by the specific gravity of the fluid. For standard water at 60 degrees Fahrenheit, the specific gravity is 1.0. This calculation is a fundamental step in having a pump performance curve explained for selecting industrial hardware like Goulds Water Technology Pumps from a technical catalog.
0 comments